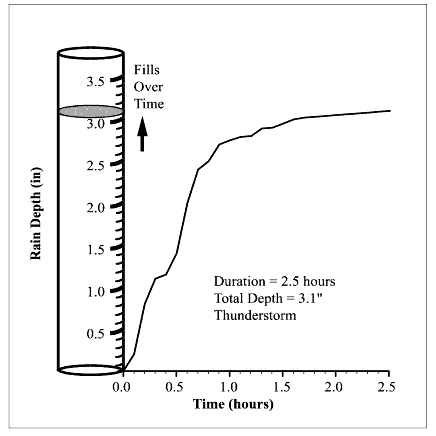
Gauged (Time Versus Depth)
A rainfall curve is the measure of total rainfall depth as it varies throughout a gauged storm. A good way to understand a rainfall curve is to visualize the Y-axis as a rainfall gauge. As the storm progresses, the gauge begins to fill. The curve describes the gauged rainfall depth at each point during the storm.
A steeper slope on the curve indicates the gauge is filling faster than it would for a less-steep curve; hence, the rate of rainfall is more intense. The most intense portion of the storm occurs between 0.1 and 0.2 hours and again between 0.5 and 0.6 hours (about 0.6 inches over 0.1 hour = 6 inches-per-hour intensity).
Gauged Rainfall Event
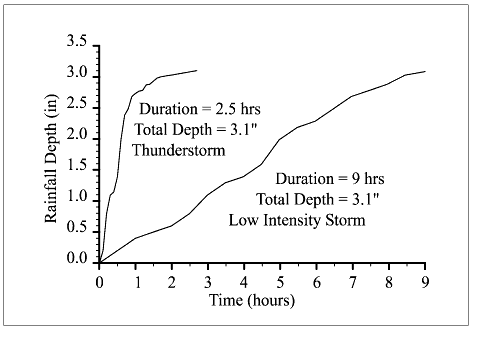
Rainfall curves are a mathematical means for simulating different storms. The next figure shows conditions for two types of storms. The other two display dramatic differences between these two rainfall events, even though the total depth and volume are the same for each storm.

Conditions for Two Storms
Comparison of Two Storms

Hydrographs for Two Storms